DOWNLOAD dataset HERE: https://data.gov.sg/datasets/d_b89e35ce38cb93a17f5c016e71f50690/view
This dataset from [data.gov.sg](https://data.gov.sg) provides:
– Singapore’s merchandise imports, categorized by **commodity divisions**
– Reported on a **monthly basis**, currently from **January 1976 to March 2025**
– Does **not specify origin countries** — data reflects total imports regardless of source
In international trade statistics and classification systems (like HS, SITC, or CPC), “N.E.S.” or “nes” or “Nes” stands for:
👉 “Not Elsewhere Specified” 🔍 What it Means: It’s a catch-all category for items that:
- Don’t fit neatly into the existing detailed classifications
- Are miscellaneous or residual goods in that group
- May be too specific or uncommon to have their own sub-code
📦 Example: “Non-Metallic Mineral Manufactures, NES” might include:
- Unique construction materials
- Specialized ceramic items
- Non-metal mineral products not classified under other standard codes like glass, cement, or stone
So in the dataset, “NES” just means it’s a miscellaneous category for that commodity group.
Insights
🏅Example Takeaways:
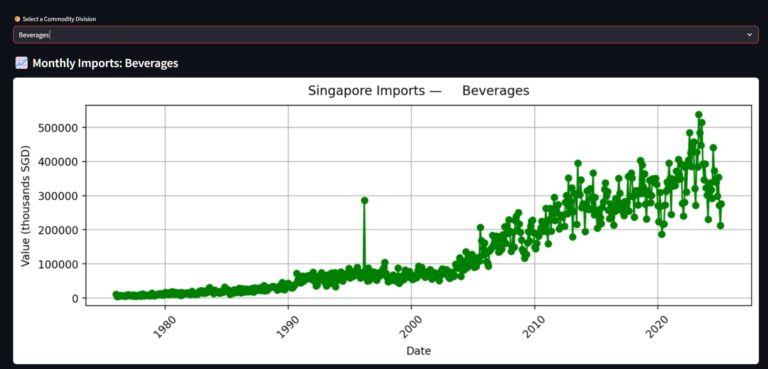
– Beverages: Singapore’s beverage imports have shown a strong upward trend since the 1990s, with notable growth from the early 2000s to 2020, followed by some volatility and a slight decline in recent years.
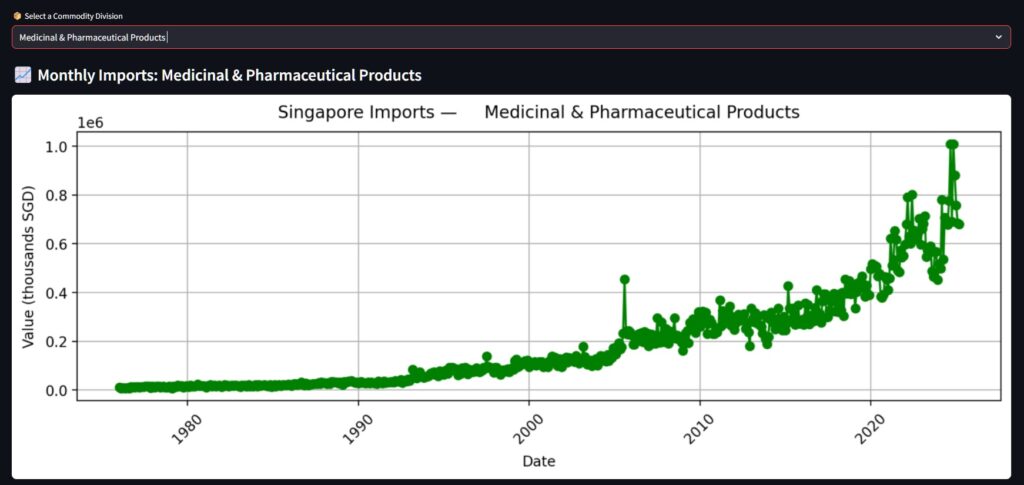
– Pharma: Singapore’s imports of medicinal and pharmaceutical products have surged steadily since 2000, with a dramatic spike around 2020–2022 likely driven by the COVID-19 pandemic and successive epidemics, reaching record highs in recent years.
– Fuels & Energy: May reflect Singapore’s lack of natural resources — high fuel imports for power, refining & re-exports
– Machinery & Electronics: Often imported for manufacturing or re-export from tech hub
– Food & Agriculture: Trends could relate to population growth, supply chains, or policy changes
Data Source
📌 Data Source: data.gov.sg — Monthly Commodity Division (1976–2025), again, if you haven’t, DOWNLOAD dataset HERE : https://data.gov.sg/datasets/d_ccaae92652c42740829ab17013a698c2/view
📁 Upload the ‘MerchandiseImportsByCommodityDivisionMonthly.csv’ file