
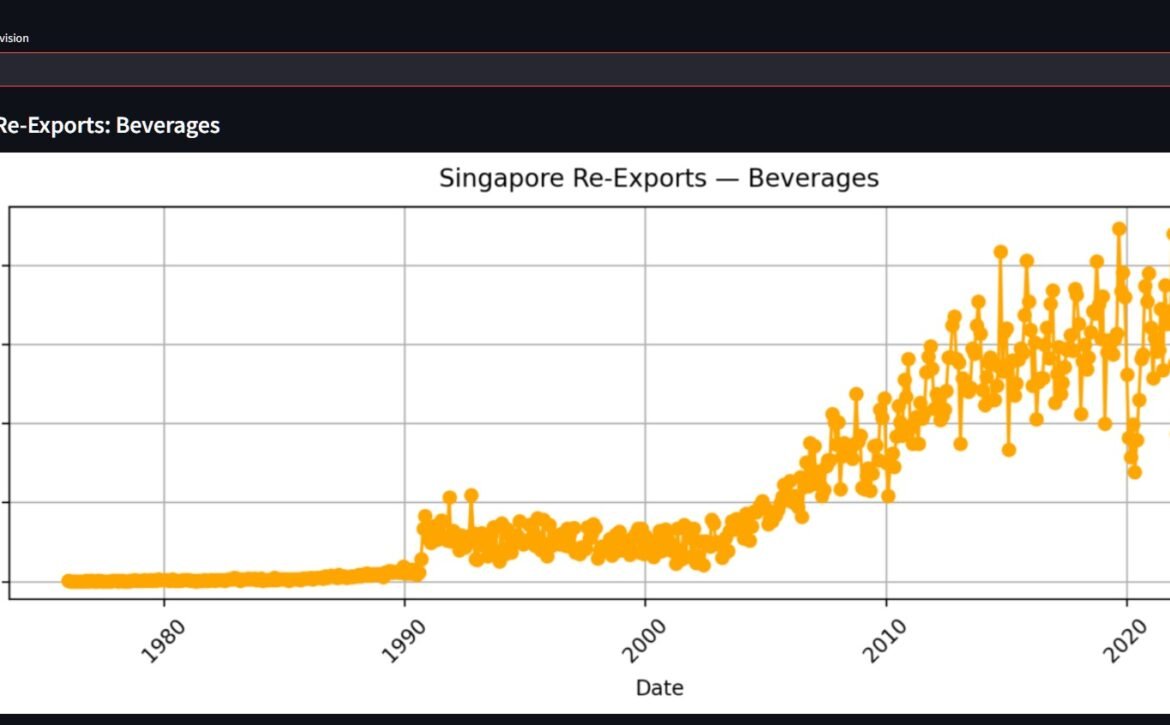
Singapore Commodity Consumption
 About This Dataset
What’s This?
A Data Science project: Making Guesstimates.
This dashboard estimates internal consumption in Singapore using the formula:
Consumption=Imports−Re-Exports\text{Consumption}=\text{Imports}-\text{Re-Exports}
Live Consumption Dashboard
Original Streamlit application. Current availability has not been verified.
Understanding N.E.S. (Not Elsewhere Specified)
In international trade statistics and classification systems such as HS, SITC, or CPC, “N.E.S.”, “nes”, or “Nes” stands for:
Not Elsewhere Specified
It is a catch-all category for items that:
Don’t fit neatly into existing detailed classifications.
Are miscellaneous or residual goods in that group.
May be too specific or uncommon to have their own sub-code.
For example, “Non-Metallic Mineral Manufactures, NES” might include unique construction materials, specialized ceramic items, or non-metal mineral products not classified under standard codes like glass, cement, or stone.
In this dataset, NES simply means a miscellaneous category within that commodity group.
 Insights
1. Singaporeans Consume More Edible Oil, Tea, Cocoa and Spices
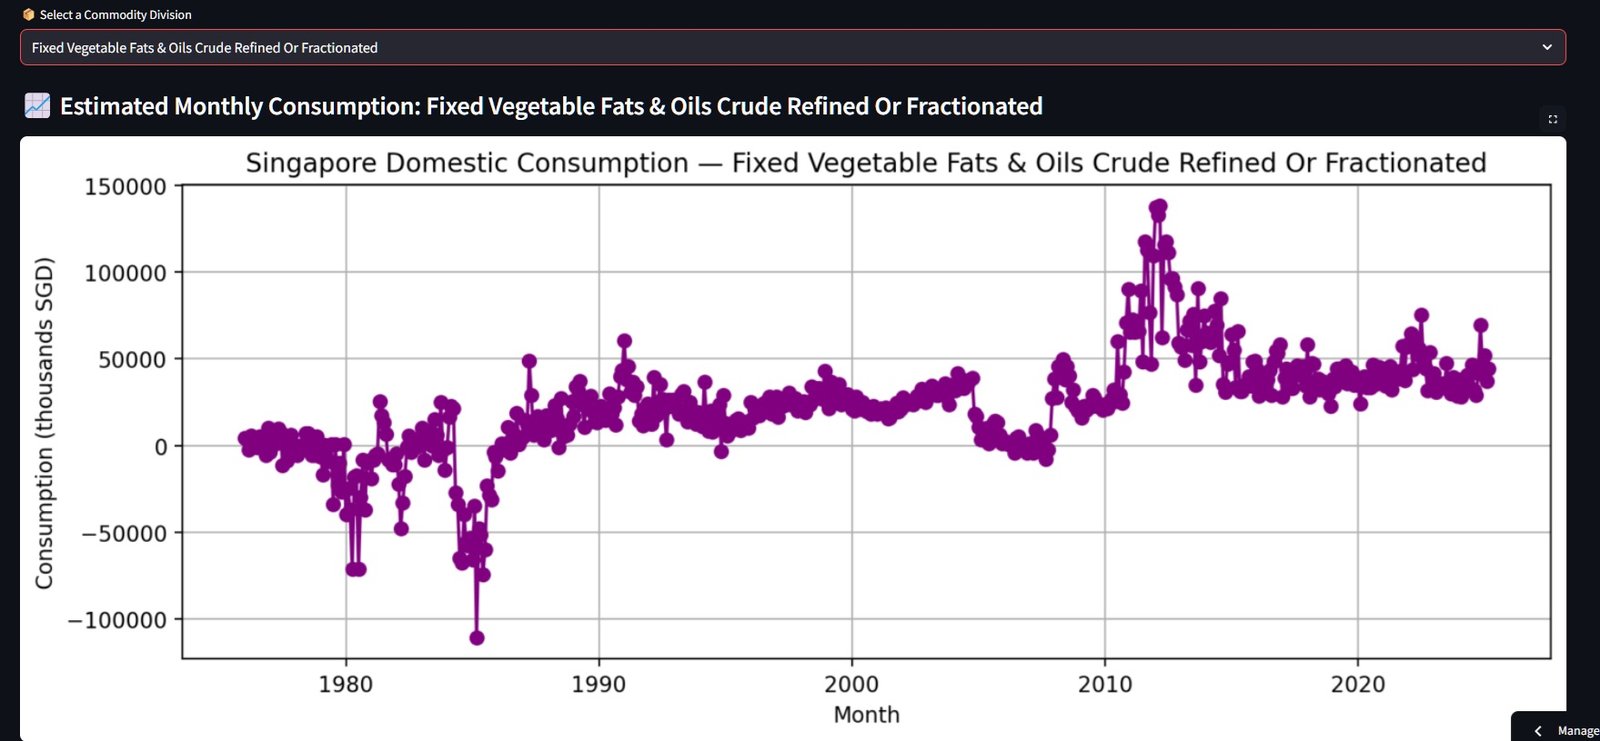
Edible oils (Fixed Vegetable Fats & Oils) show volatile trends with large spikes and drops, but since 2010 the average monthly consumption appears to have stabilized at higher levels than pre-2000, indicating moderate to increased usage over time.
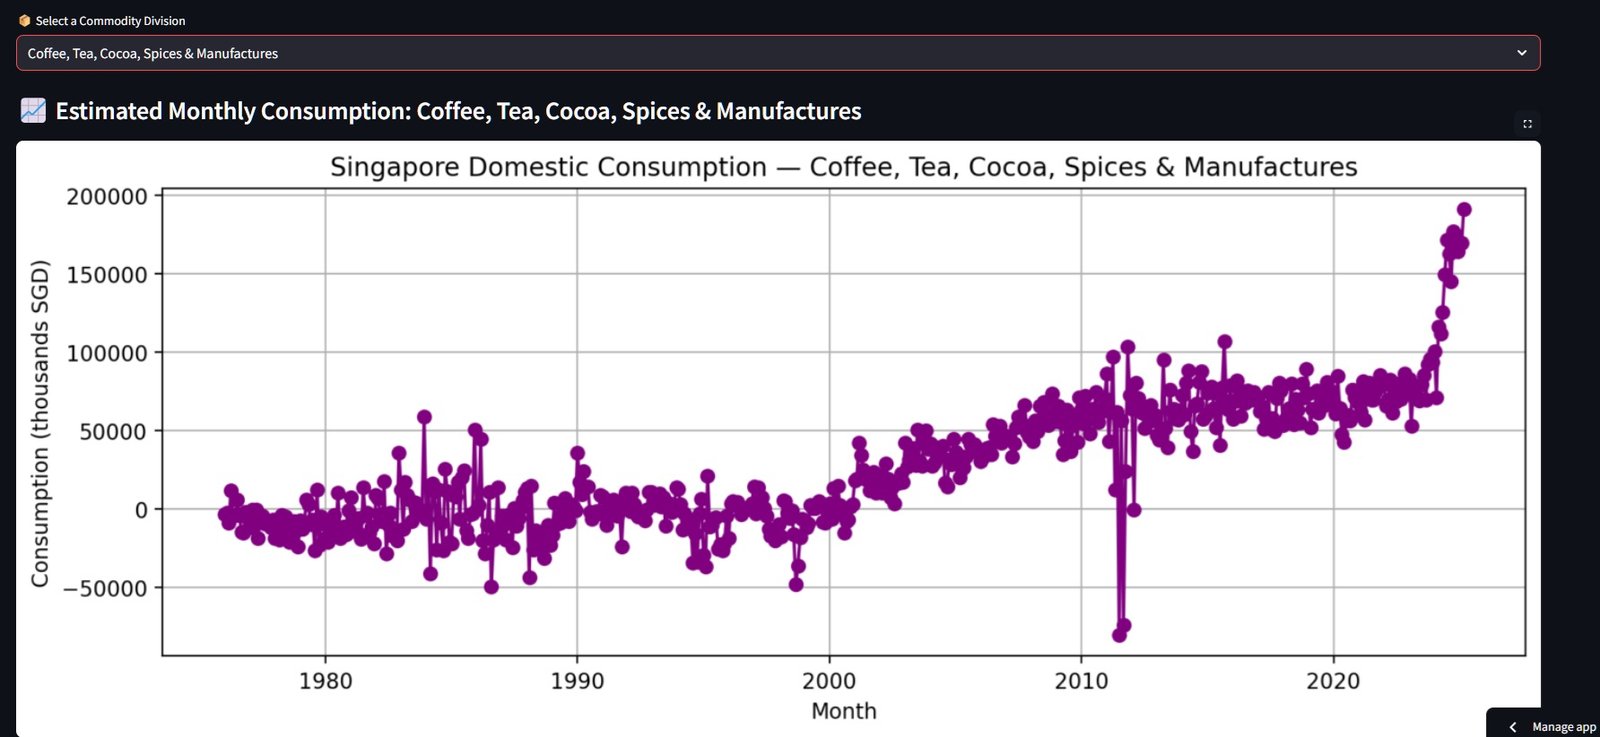
Coffee, Tea, Cocoa, Spices & Manufactures show a clear upward trend, especially after 2010, with a strong spike in recent years — strongly suggesting growing consumption habits among Singaporeans for these products.
Original charts — Edible Oil and Tea
2. Singaporeans Are Rapidly Phasing Out Paper
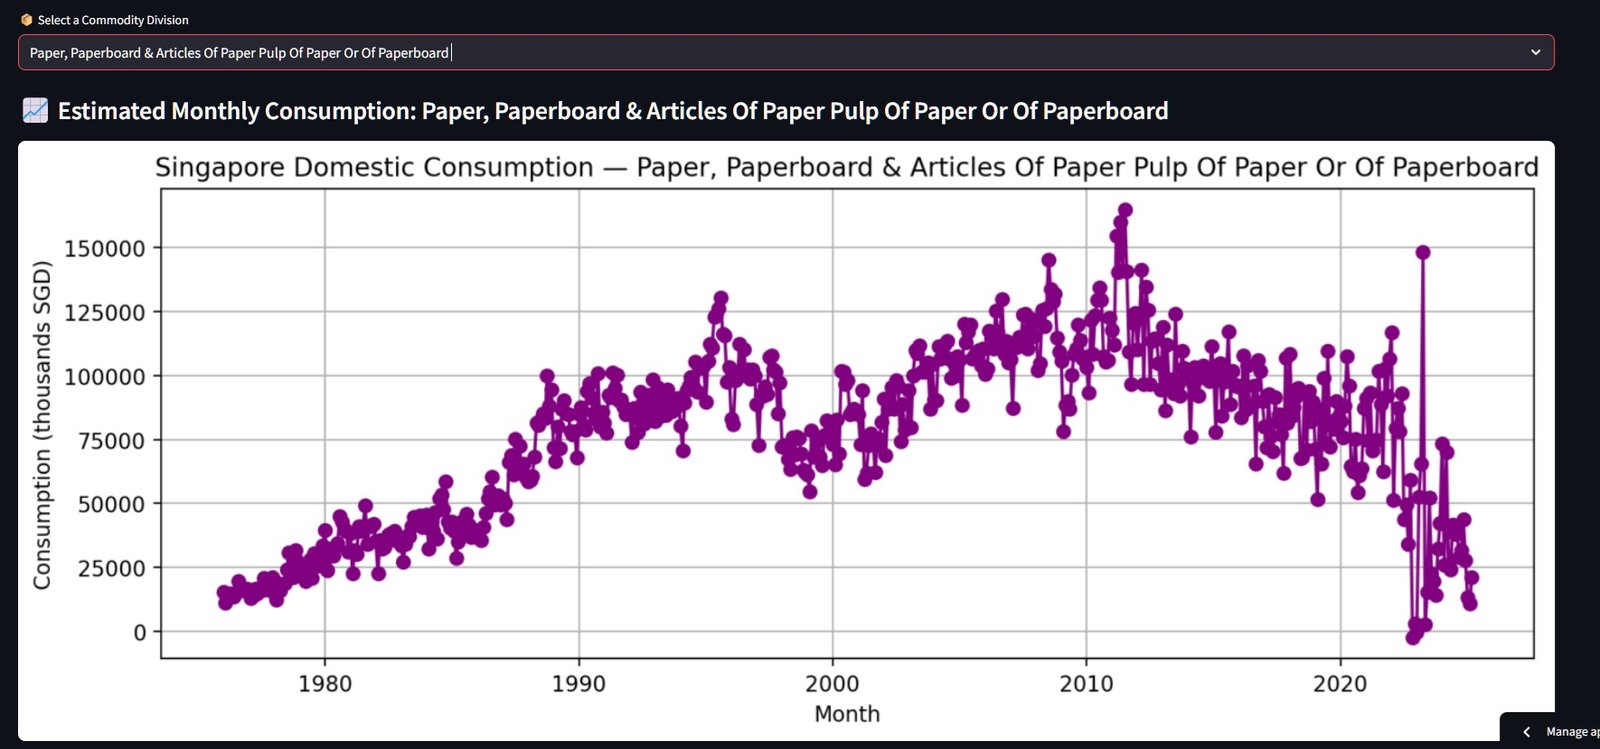
Singaporeans, both individuals and industries, are rapidly phasing out paper, aligning with digital and environmental trends.
Original paper consumption chart
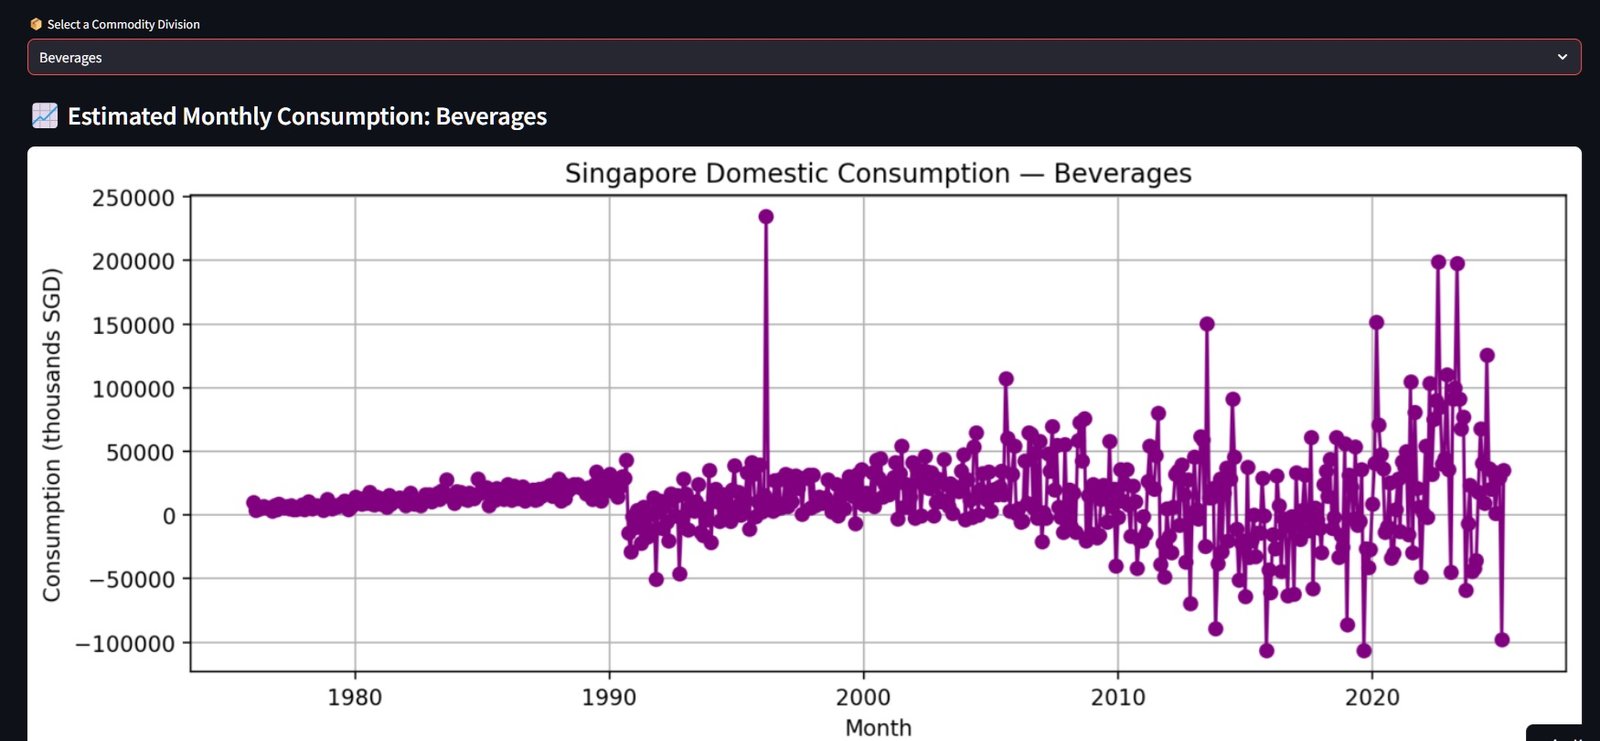
3. Singaporeans Will Be Consuming Less Beverages
The chart suggests potential stagnation or even decline in Singapore’s domestic beverage consumption, especially in recent years.
Key signs include:
Heavy fluctuations and sharp negative values after 2010, possibly indicating inventory re-exports exceeding imports, seasonal dumping, corrections, or trade anomalies.
Lack of a clear growth trend after 2015. Consumption appears more volatile and flat, if not declining.
Compared with pre-2010, earlier decades showed steadier or moderate growth.
Possible factors include market saturation, a shift toward healthier or alternative drinks, and export-driven beverage trade resulting in less local use.
Unless corrected, these data may imply lower domestic beverage demand, or at least more erratic patterns going forward.
Original beverage consumption chart
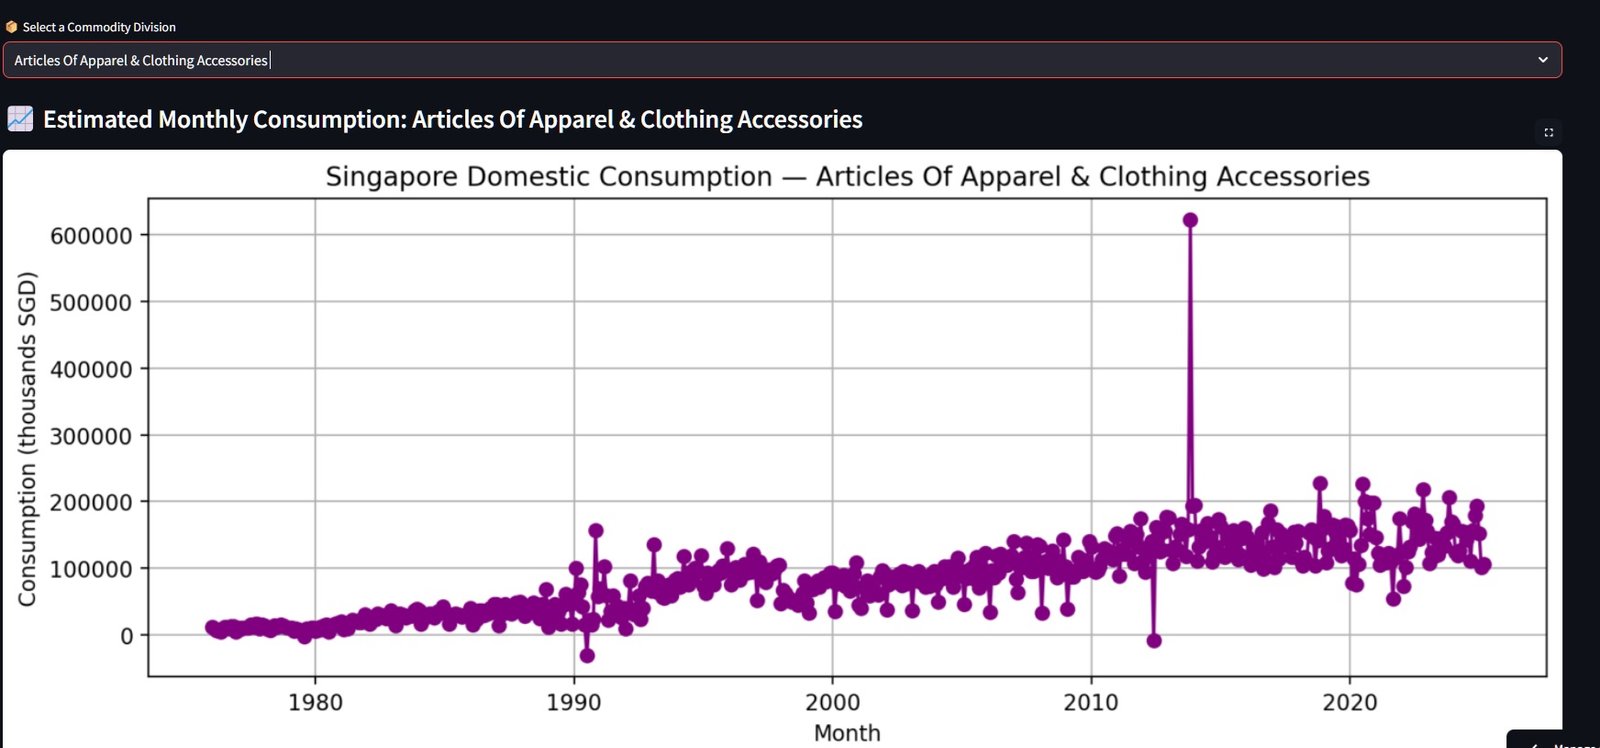
4. Stable Clothing Consumption
Singaporean net domestic clothing consumption is modest and stable, but masked by high re-export flows and global supply chain roles.
Original clothing consumption chart
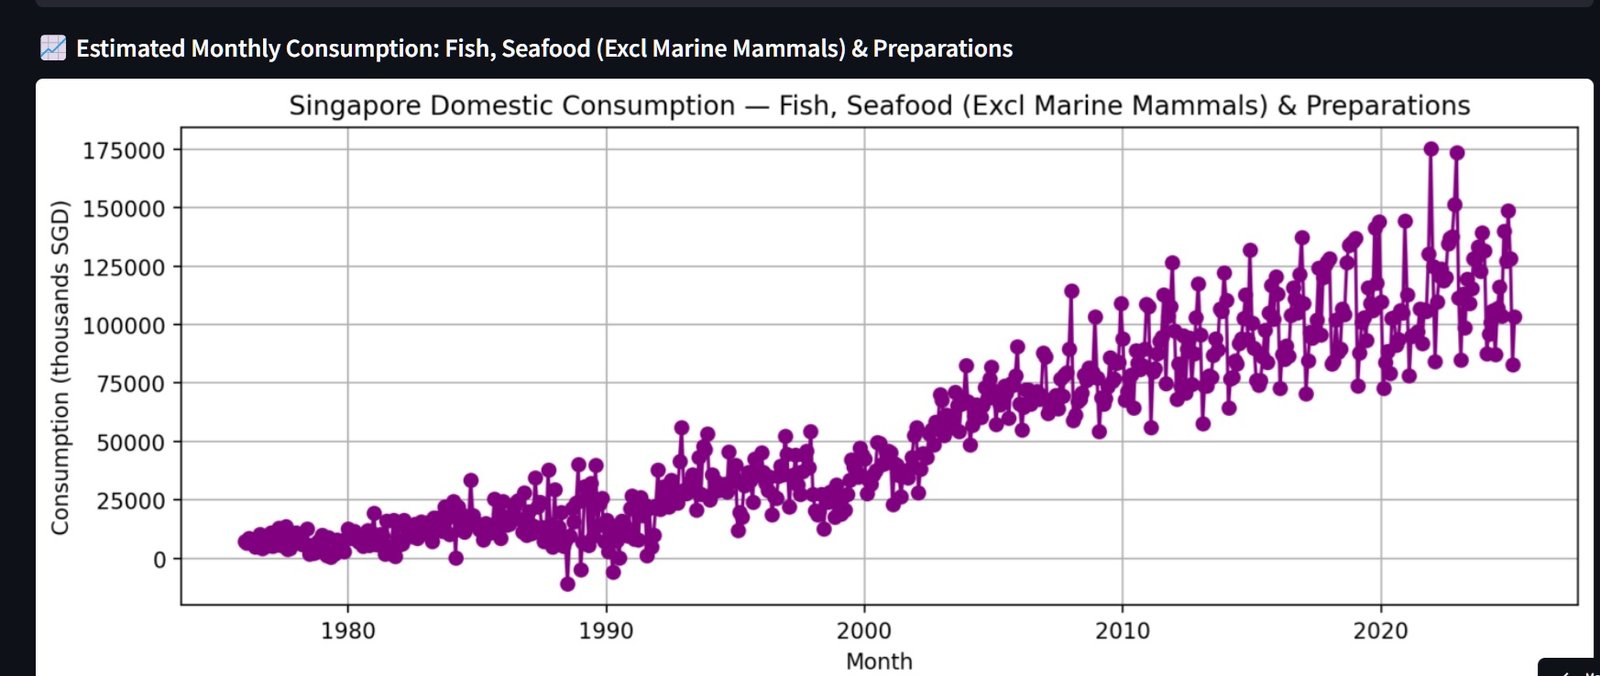
5. Singaporeans Are Consuming a Bit More Fish & Seafood
The chart strongly suggests that Singaporeans have been consuming more fish and seafood over time.
Key observations:
Long-term upward trend in domestic consumption from the 1980s through the 2020s.
Especially sharp growth after the early 2000s, possibly due to population growth, dietary shifts, or improved trade access.
Spikes and volatility in recent years could reflect seasonal demand, stockpiling, or supply chain shifts, such as during COVID.
The data support the interpretation that internal demand for fish and seafood has increased significantly.
Original fish and seafood consumption chart
View the Interactive Dashboard
Singapore Consumption Dashboard
Explore the interactive commodity consumption estimates.
 Data Source
The project uses two CSV datasets:
MerchandiseImportsByCommodityDivisionMonthly.csv
ReExportsByCommodityDivisionMonthly.csv
The estimates are calculated by subtracting re-exports from imports.
Editorial note for republication: These are the original article’s interpretations. Imports minus re-exports is an approximation, not a complete measure of domestic consumption, because inventory changes and other trade flows are not accounted for. The dashboard, chart files, and conclusions should be verified before republishing them as current findings.